We can't usually go and count all the individuals in an animal population. They're too hard to see (fish underwater), too hard to find (moose in the bush), there are too darn many of them (mosquitoes), and so on. Instead we have to take a sample and infer the
population from our sample.
Mark-recapture is a common way of doing this. We capture a sample of the population, mark them and release them back into the environment. Sometime later we capture a second sample that will contain some marked and some unmarked animals. We can infer the total population from the ratio of marked (recaptured) to unmarked animals in the second sample. But of course the result is not exact, it is an estimate, and so we are uncertain about the true value of the population. How uncertain? That's the question we work towards answering in the first two classes this week.
Monday we review our basic combinatorics formulas, then play with a Quincunx, flip some coins, and discover that mathematicians have ruined it all by naming these things Bernoulli trials and Binomial distributions. 😆
Wednesday we will put our new tools to use to determine the likelihood of our estimate of the number of fish in the lake.
We will be using our calculators this week, focussing on some buttons that may be new to you, so don't forget to bring yours with you. And Wednesday you might want to bring your laptop to follow along some Excel work.
And then we switch gears...
Modelling Structure: Graph Theory
Ecology and ecosystems are all about connections and the interactions between things, but our
models have mostly focussed on the optimal behaviour exhibited by individuals (whether
corporate or animal). How do we describe, model and analyse systems of things?
The key is to
have a way of representing and quantifying the structures of a system: its physical
structure sometimes, but also the structure of the interactions of its components,
whether that is the flow of nutrients, or energy, or $, or prestige, or... Graph theory provides us with the
tools we need to do this, and is the final topic of the course. 😅
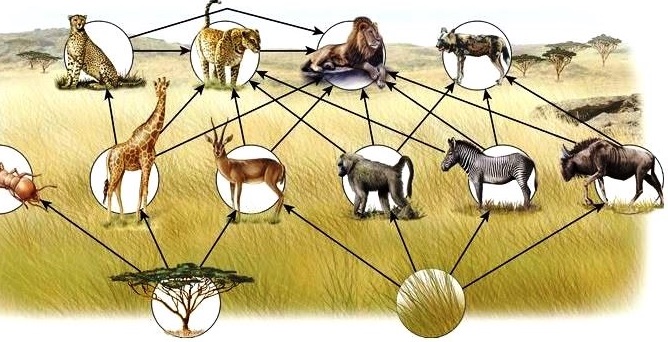
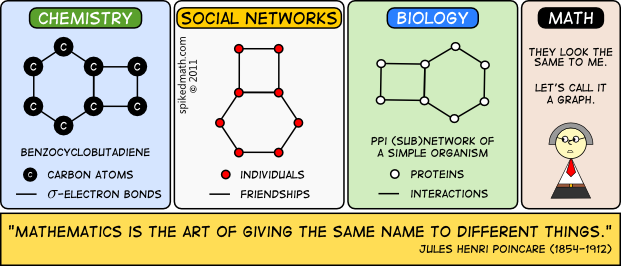
These are not the graphs of functions you are used to, but circle and arrow diagrams like the
image above (sans the animal pictures). They have a surprising number of uses.
Friday An introduction to vertex-and-edge graphs, and two algorithms: Minimal Spanning
Tree (MST) and Shortest Route.
The last fresh start + Don't lose your grip now!
This week will complete our brief look at modelling uncertainty using probability, and begin the final three-week section of the course on Graph Theory. It gives you your last fresh start of the course, and marks the beginning of the home stretch. Don't lose your grip now! 💪
For your convenience: Yukon Biodiversity Forum Registration Link